|
The UPDD Demonstration program is supplied as both a
useful tool but also as an example program using the UPDD API. Source code
is available for download for both C++ (UPDD 4.1.8 –
Visual Studio 2010) and Visual Basic.
These versions work with UPDD version 4.1.x and above. The executable for UPDD 4.0.x, UPDD 4.1.6, UPDD 4.1.8 and
4.1.10 (and above) are also available for download.
Unzip the .zip file to the UPDD application folder
(normally c:\program files\updd)
This version is Windows only however a multi-platform
version (utilising QT graphics library) is planned.
To invoke the demo program locate and run UPDDdemo.exe.
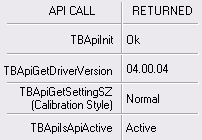
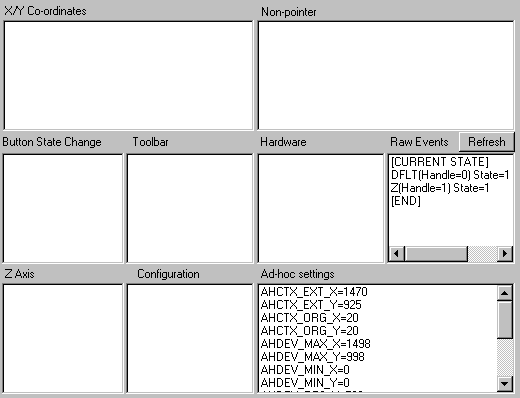
The UPDDdemo dialog has a display area to show data generated by the driver,
an API area to perform API functions and a general area to perform specific
function as described below:
Device List
|

|
This drop-down list reflects the currently selected
device. Driver events are filtered for the selected device only. If more
than one device is connected, it is possible to select and monitor events
for each device, or ALL.
|
Sending Macros
|

|
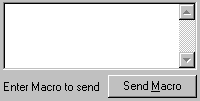
Using the UPDD Macro Language, it is possible to execute
a macro from this window. Enter the macro name and click Send Macro.
Internally, the program makes a call to TBApiSendMacro.
|
Sending Data
|

|
This area is used to send data to the pointer device
controller using the TBApiSendData
API call.
|
Function Area
|
Function button
|
Description
|
|

|
Empties all the callback
windows. Note that a callback window's contents are cleared automatically
after 300 events have been displayed.
|
|

|
Some controllers may
occasionally output data in a random manner, say in response to a controller
command, that does not have a specific format and cannot be defined as a
recognisable packet in UPDD. In normal operation such data would cause a
UPDD sync error and be ignored. However, if this data is required by an
external application then an API exists, TBApiRawDataMode, to
handle all controller generated data as non-pointer data. This button
toggles between Normal mode (packets are interpreted as expected) and Raw
mode.
|
|

|
Clicking this button will save
the displayed settings and contents of each window to a text file named
UPDDDEMO.TXT. This may be useful for support or debugging purposes. Once
settings have been dumped, the full pathname of the TXT file is displayed
to aid location.
|
Display area
This area contains a number of windows used to display
information returned from the driver as a result of the program registering a
callback via the TBApiRegisterDataCallback
API call (all, except Ad-hoc Settings).
An application can request that the driver calls the
application when certain data packets or state changes take place.

Examples of the data shown and its meaning is shown below:
|
Display area
|
Description
|
|
X/Y co-ordinates

|
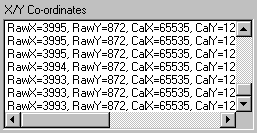
The 'co-ordinates' window shows callback
events for the constant ReadDataTypeToolbar (0x0001).
This window shows both raw x and y
co-ordinates generated by the pointer device and the calibrated
co-ordinates fed into Windows.
The relative time (tick) that the event was
read and the originating device id are also displayed.
|
|
Non-pointer

|
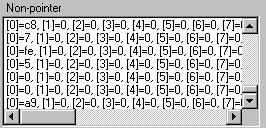
The 'Non-pointer' window shows callback
events for the constant ReadDataTypeData (0x0008) i.e.
[0]=hexvalue, [1]=hexvalue, [2]=hexvalue,
etc... (16 bytes in all) where hexvalues are taken straight from 16 byte
array structure.
|
|
Button State Change

|
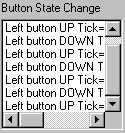
The 'Button state change' window shows
callback events for the constant _ReadDataTypeEvent (0x0002).
Data returned from the driver includes pen
up/down, left or right button indication, tick count (indicates the
relative time data was read), and the identifier of the device generating
this event.
|
|
Toolbar

|
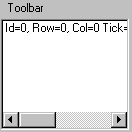
The 'Toolbar' window shows callback events for
the constant _ReadDataTypeToolbar (0x0010)
i.e. Toolbar Id=n, Row=r, Col=c
where n,r & c are integer values taken
straight from the PointerData structure.
Also shown are the relative time (tick) and
originating device id.
|
|
Hardware

|
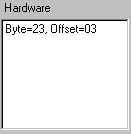
The 'Hardware' window shows callback events
for the constant _ReadDataTypeHardware (0x0004) i.e.
Byte=hexvalue, Offset=hexvalue
where Byte is the new value of the register
and Offset is the position of the register relative to the port base
address.
|
|
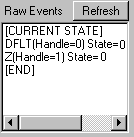
Raw Events

|
Shows the current state of the protocol
events.
|
|
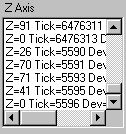
Z Axis

|
If the controller supports Z axis this area
shows the value of Z, the device which generated it and the relative tick
time between packets.
|
|
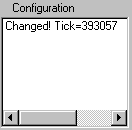
Configuration

|
The 'Configuration' window shows callback
events for the constant _ReadDataSettings (0x0020).
This indicates that the driver
configuration has changed. The application would then be in a position to
run other API calls to determine if the changes are critical to the
application, such as a device deleted.
The relative time (tick) that the data was
read is also displayed.
|
|
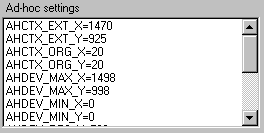
Ad-hoc settings

|
Displays device-specific configuration
parameters retrieved from the driver. This data is used in Wintab
applications and describes certain features of the controller.
|
Contact
For further information or
technical assistance please email the technical support team at technical@touch-base.com
|
