|
This document describes the procedure we have built in to
the UPDD Software Suite to capture the touch data generated from a pointer
device and store it in a log file for further analysis. The data is captured
from a series of 5 screens, each displaying a different pattern to capture
the data when a stylus is used to trace the pattern on the touch surface. The
data generated by the touch screen is captured and saved to a log file.
When using this data capture function please consider the
following requirements:
- Important note. When using the capture procedure
below only one UPDD supported device should be connected and listed in
the UPDD Console. If more than one device is supported the captured
data is likely to be corrupted.
- The driver must be configured correctly for the device,
e.g. in the case of a USB device the correct Vendor and product id must
be defined in the driver such that the UPDD driver is seen by the OS PnP
manager as the device driver for the device. In the case of serial the
correct com port and baud rate must be selected.
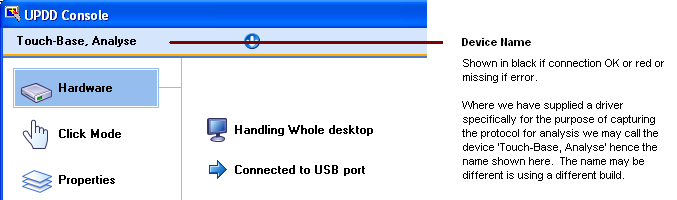
The device name should
show in black if it has correctly connected with the USB device or
opened the com port:
- The diag function captures
data being delivered from the com port or USB device. USB data is
captured using interrupt transfers. If we have been supplied sufficient
technical information about the device the driver will be configured to
capture data from the expected USB interface and endpoint otherwise it
will be set by default to capture data under Windows via the first ‘in’
endpoint on interface 0. Under Linux or Mac OS X the data is captured on
endpoint 1, interface 0.
If no data is captured then it is likely that either the device is
not working, the device needs initializing before touch data is
generated, the device needs to be placed into a special mode of
operation or, for usb devices, the output is delivered on a different
endpoint / interface to that configured in the driver or via an
unsupported USB transfer mode, such as Isochronous.
For USB devices whereby no data is captured
there are other options available
to capture the protocol data.
Capture procedure
The procedure can be invoked
via the UPDD Console under UPDD 5.1.x with the resultant log file saved on
the desktop or manually via the command line utility.
The driver will either be
receiving the touch data directly from the controller or, in the case of a
HID configured controller, the data will initially be processed by the UPDD
HID parser. The trace facility can be used to capture unprocessed or
processed HID data.
Invoked via the UPDD Console
The “Diagnostic trace tool”
option captures data delivered to the driver. The ‘Diagnostic trace tool
(raw)’ option (since UPDD 5.1.1136) will be shown to bypass the HID parser
processing and capture raw data from an HID configured device. If this option
is not shown then the data is not being pre-processed.
Unless otherwise requested
please use the ‘raw’ option if it is shown.
Select the Dump settings
option in the Status tab and select the required trace.

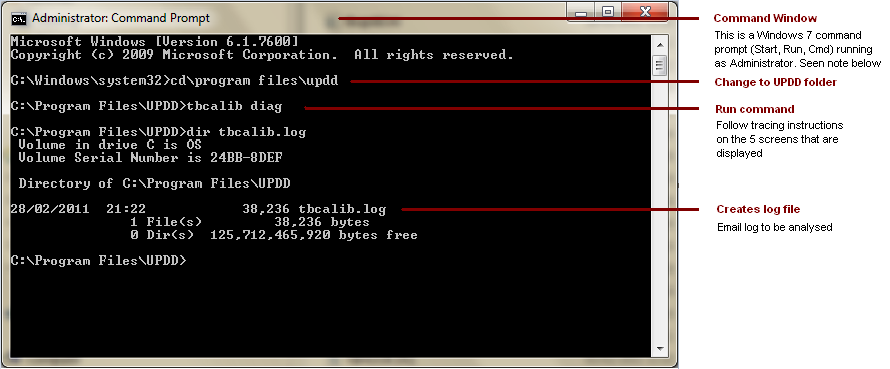
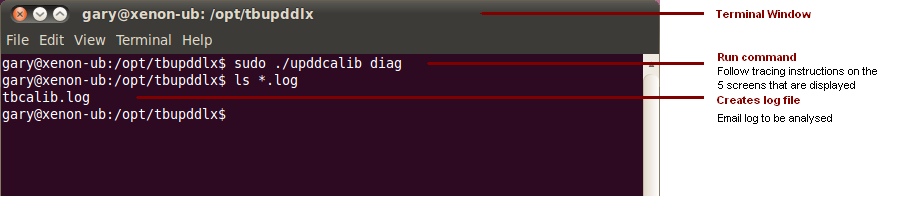
Manually invoking the procedure
With version 5.0.2 you have to manually invoke the command
‘tbcalib diag’ as shown in the OS sections below. Since UPDD 5.1.1136 you
can also run ‘tbcalib diagraw’ to capture raw touch data from a HID
configured device.
Please note:
- If executed on a multi touch
device system only the first device is tested, or you can pass Device=n
to define a UPDD device handle.
- With 5.0.2, the log file is
written to the current directory so the user must have write access
- With 5.0.2, on windows
systems ensure that you run the program as an administrator.
- With 5.0.2, on non-windows
systems ensure that you run the program from a writeable directory, e.g.
“~” (home).
One way to run the tbcalib command is via a
command/terminal dialog as shown in the OS examples below:
Windows
- Start, Run, cmd
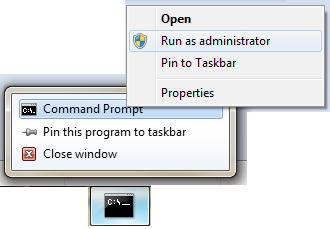
If, after running the protocol capture
procedure, no file is created it is likely that the command prompt is not
running as Administrator. This is particularly true in Windows 7 with UAC
enabled. In this case, right click on the Command Prompt task bar entry and
right click on the Command Prompt menu item and select Run as administrator.
This should work in most cases:
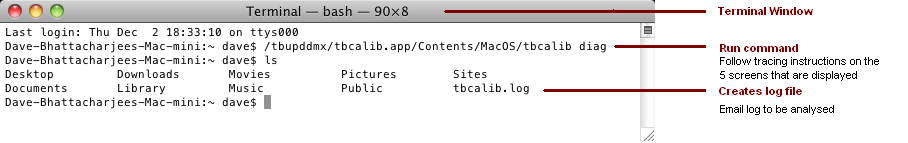
Mac
OS X – Utilities/terminal
Depending
on the version of the UPDD driver the path to the command is different.
Select the command appropriate to the UPDD release you are running. Please
note that in some cases you will see an error message reported when running
the command:
tbcalib[200]
<Error>: kCGErrorInvalidConnection: CGSGetWindowTags: Invalid
connection
tbcalib[200] <Error>: kCGErrorFailure: Set a breakpoint @
CGErrorBreakpoint() to catch errors as they are logged.
These
errors do not stop the log being captured and can be ignored.
UPDD
version 5.0.2 / 5.1.x
Run the
command /Applications/Utilities/UPDD\ Calibration.app/Contents/MacOS/tbcalib
diag

UPDD
version 4.1.10
Run the
command /tbupddmx/tbcalib.app/Contents/MacOS/tbcalib diag
Linux – Applications/accessories/terminal (location
dependant on distribution)
Upddcalib is a script that sets a environment variable (export LD_LIBRARY_PATH=/opt/tbupddlx:$LD_LIBRARY_PATH)
and then invokes tbcalib program. If you have any difficulties running this
then try
sudo ./upddenv tbcalib diag – this runs
with root
admin privileges , sets the environment and calls tbcalib.
Screen sequence
The sequence below shows the screens that are displayed to
capture touch packet information
|
|
|
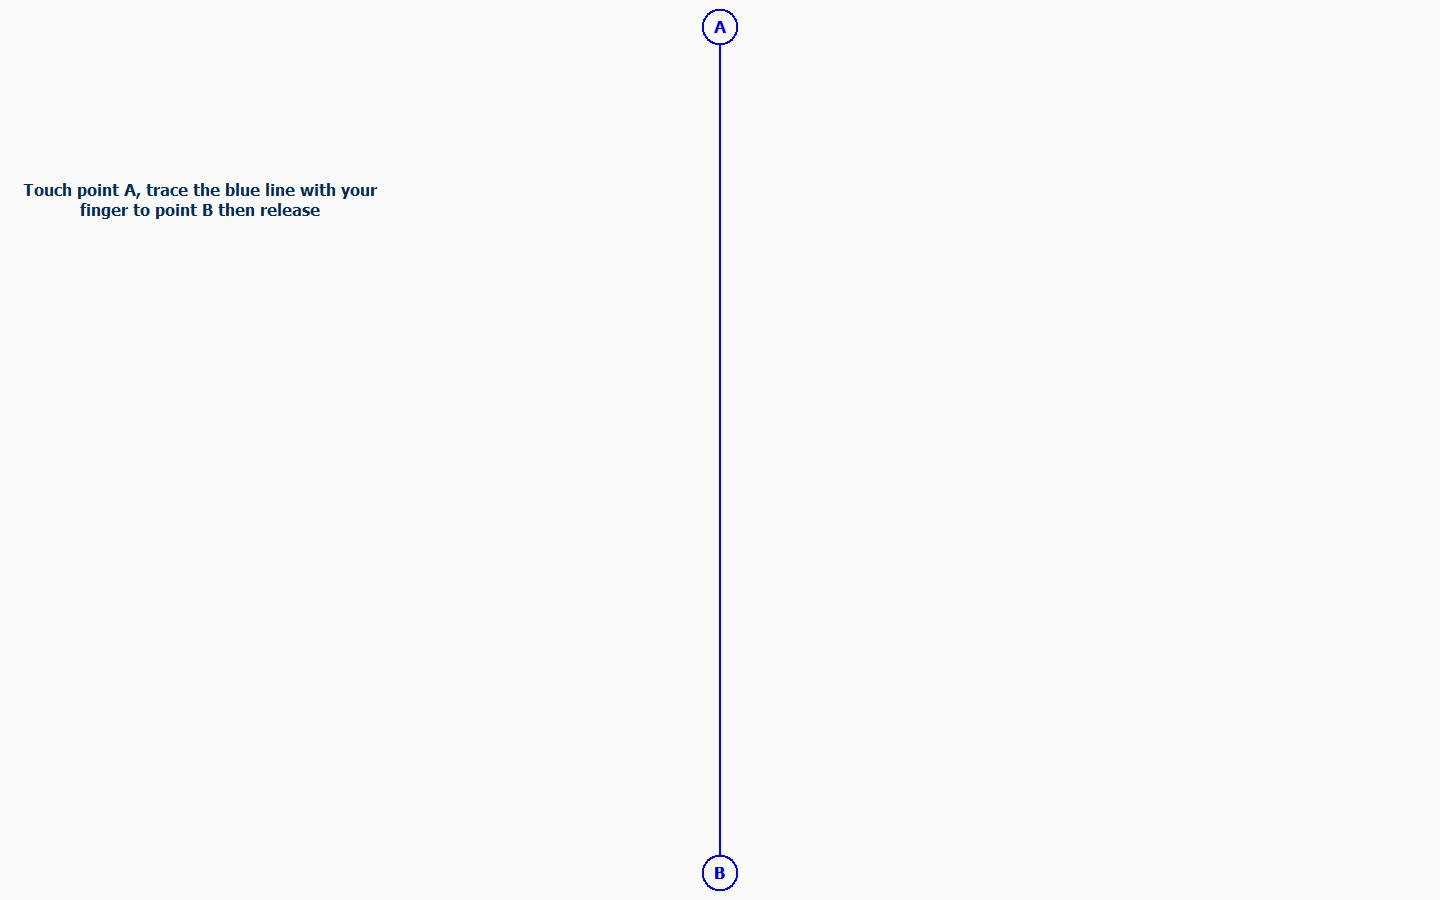
1 - This screen captures vertical, top to bottom data
sequence
|
|
|
|
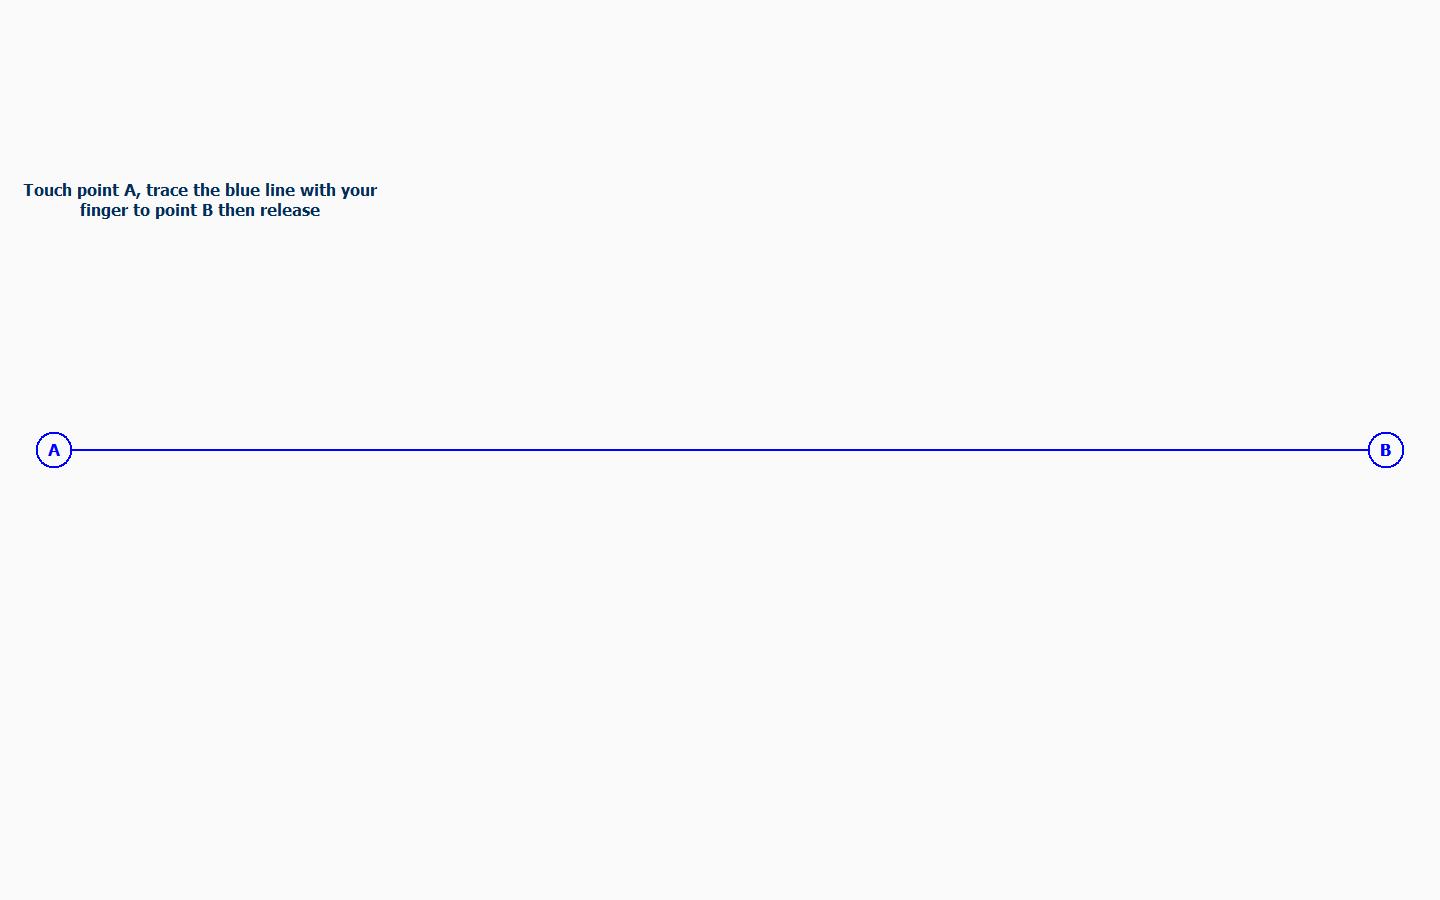
2 - This screen captures horizontal, left to right data
sequence
|
|
|
|
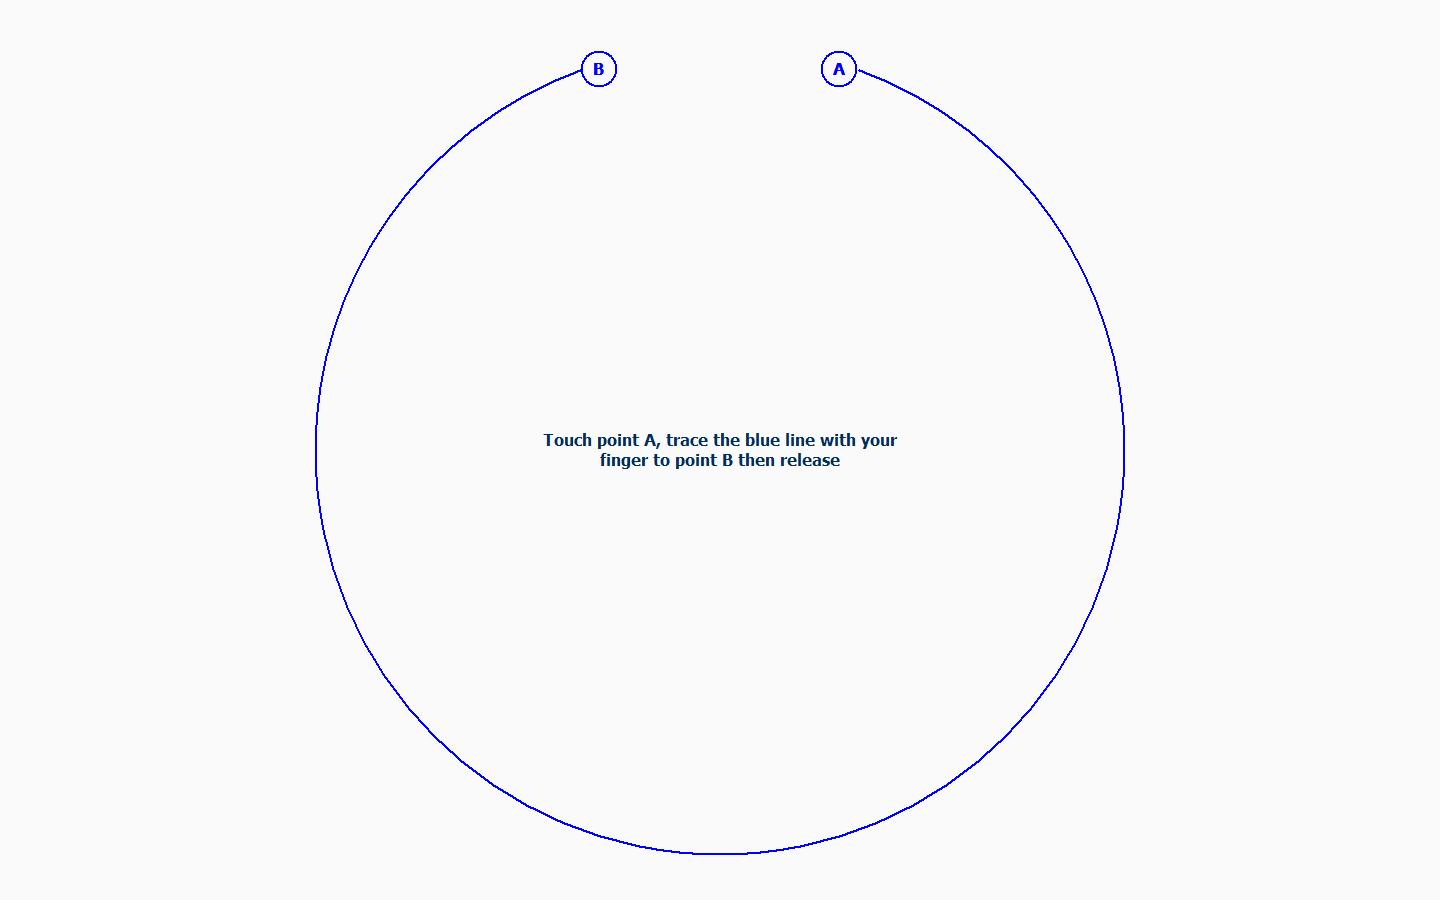
3 - This screen captures clockwise circular motion
|
|

|
|
4 - This screen captures dual touches, left to right
diagonal. On a single touch system still touch with 2 fingers and follow
instructions.
|
|
|
|
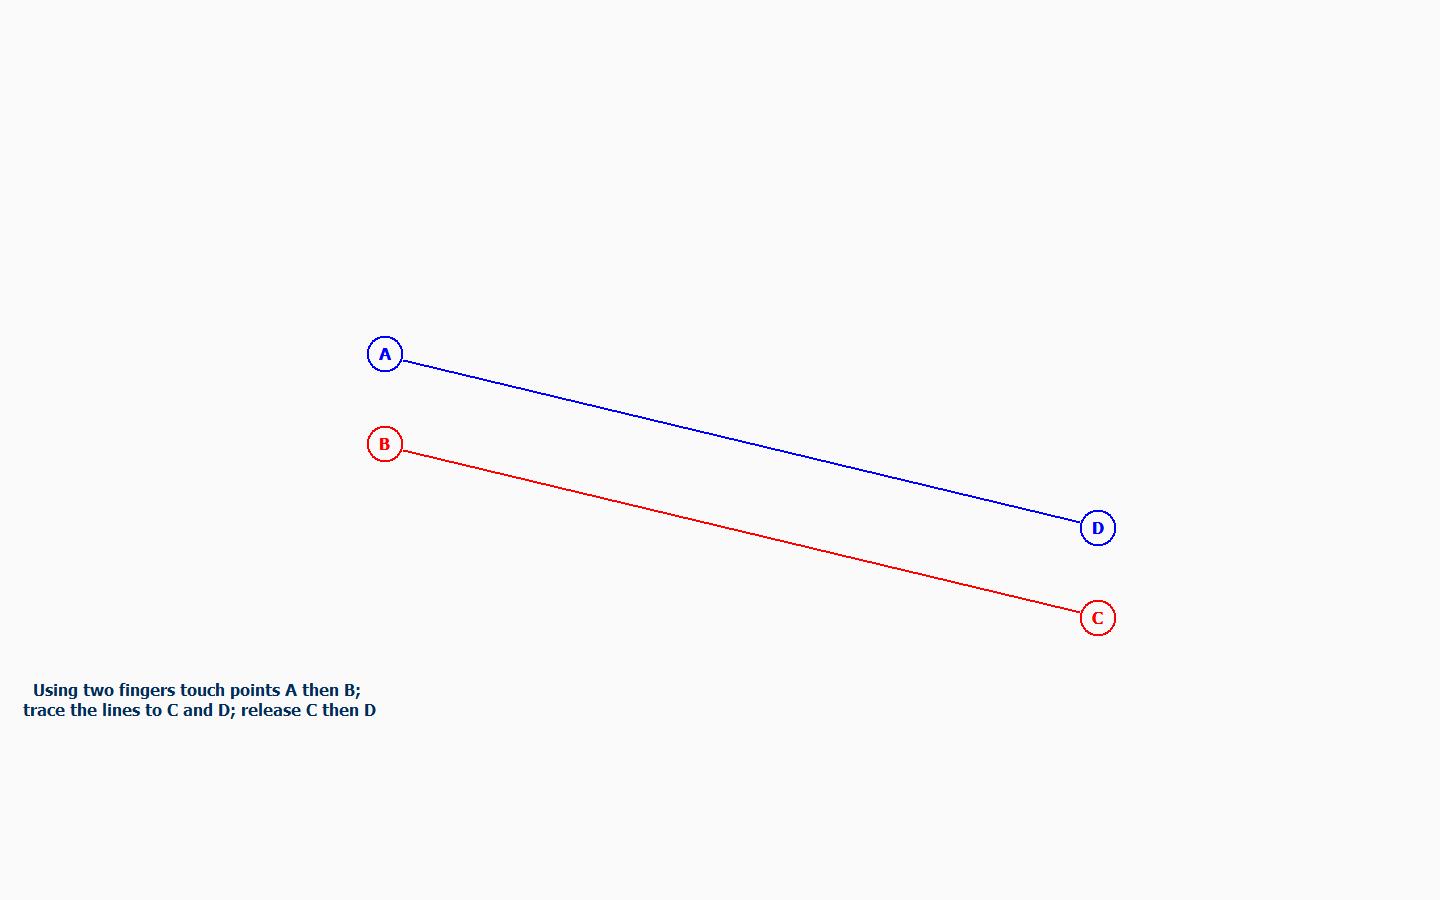
5 - This screen captures dual touches, left to right
diagonal with a different stylus lift off sequence. On a single touch system
still touch with 2 fingers and follow instructions.
|
Log file
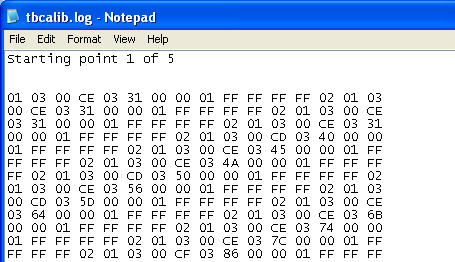
The log file, tbcalib.log, will record captured data.
If the files is empty:

It is most likely that…
- for serial devices you have the wrong com port or the
controller needs initialising to enable touch data or you have a
hardware issue
- for USB devices the touch data is not delivered on
endpoint 1 or the controller need initialising to enable touch data.
If you are using a USB device, see here for an alternative method of capturing the data
and/or the initialisation sequence.
If the file contains garbage: (does not show
touch data co-ordinates - looking for a repeating pattern that has changing
values – see example below) then, for a serial device, it is most likely
that the controller is running at a different baud rate to the one set in
the driver. This can be changed in the UPDD Console, Hardware, Connected
to… option. Try capturing at another baud rate.
If data has been captured there will be 5 entries
headed ‘Starting point n of 5’ representing the data captured from the 5
screens:
Send the log for further analysis!
|
Contact
For further information or technical assistance please
email the technical support team at technical@touch-base.com.
|
|
