|
|
||||||||||||||||||||||||||||||||||||||||||||||
|
This document describes the procedures to follow if you are experiencing a problem with our pointer device driver UPDD. Please note that in most cases the advice in this document applies to our version 4.x.x drivers but specific references relate to UPDD 4.1.1 and above. Please contact Touch-Base if you need specific support assistance with 4.0.x version of the driver. As the developers of UPDD we want to ensure as best as possible that UPDD will cause as few problems as possible. Unfortunately, given all the environments in which drivers need to operate, UPDD will occasionally fail to function as expected. It is at this point we are contacted to help and you will appreciate that we need as much information as possible to help identify the problem so we can best advise or try and reproduce the problem to allow us to investigate further. Reporting that a problem occurs on a particular operating system doesn't really help, we will need specific details! Please read carefully and supply as much of the information requested. On receipt of this information we will endeavor to investigate your problem and report back ASAP. Thank you in advance for your co-operation. Obvious checksPrior to supplying this information, check the obvious such as cabling and power issues. Try and prove the hardware is working without our driver. SerialIf the driver is installed set it to access a different serial port so that the touch screen port can be used by another application. You can employ the following methods to see if there is data being received from the serial port · Windows – Use HyperTerminal or the free Touch-Base software data scope at ftp://scope:scope@ftp2.touch-base.com (Windows 2000/XP/ Vista users only) or a commercial data scope program such as Docklight (http://www.docklight.de) · Linux - Open a terminal window and type cat < /dev/ttySN and use the serial device. · Mac - Open a terminal window and type cat < /dev/[port] and use the serial device. Serial port testing is further described in the knowledge base article here. Once data is seen you need to ensure UPDD is configured for the correct serial port. UPDD will then see the data. If it sees the data expected, the mouse should move when touching the screen. If it moves, but incorrectly, try calibrating the screen. If the data is incorrect, or the wrong UPDD driver is installed (for a different touchscreen), there will be no mouse movement but there will be sync errors in the UPDD Console Status dialog. USBWith USB devices ensure the driver is loaded and the USB is recognized by the operation system.
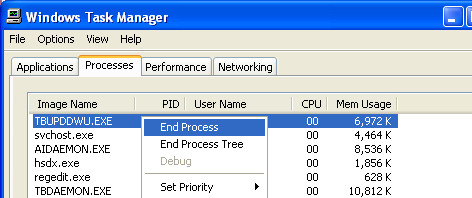
Is the mouse pointer moving but un-calibrated? In the case, does calibration work? If not, it could be that the HID driver or another driver is in control. In Windows, does the UPDD Console, Status show some status as n/a? This would imply the user mode element of the driver (tbupddwu) is not running. Check the Services or Task Manager to confirm that TBUPDDWU is running:
TBUPDDWU is the user mode portion of the driver and must be running in order for the touch device to work. It runs as a service and is set to run automatically (Registry key ‘Start’ = 2). Should, for any reason, the service fail or terminate it should ‘in theory’ restart automatically. If it is believed that the hardware is functioning as expected re-enable the UPDD driver and run the test program from the UPDD Console, Status page and select the ‘Direct’ option. In this mode the test program uses the UPDD API to receive co-ordinate data rather than mouse emulation. If drawing is seen this implies the controller is functioning but for some reason the UPDD system mouse interface is not working. If the device is correctly connected and functioning please answer the following questions as best you can (use N/A or Unknown where appropriate) Support InformationFree Format(Describe as best as you can what the problem is - list any error messages you see etc)
Operating System
Hardware related· Is there anything unusual about the system in use? · Is there any specialised hardware/configuration in use? E.g. Multiple monitors, · Is the pointer device connected to unusual hardware? E.g. Serial to USB (to serial) converter. · Are there other pointer devices installed and supported by other drivers? · Is the any other driver that could be trying to claim the same hardware port/system resources in use by UPDD? (e.g. Serial printer/Modem driver connected to the same port) · Do the ports in use by the UPDD driver show up in the system device manager or system profile? · What pointer device controller and hardware port are you using?
Install problems· Did the UPDD software install correctly? · During install did you specifically select the hardware port to use or was the auto-detect check box available and enabled? · Did you install as a result of a PnP message or did you run the setup program.
If the install appeared to be successful..... Functionality· In the UPDD Console, Hardware dialog is the correct port selected for the device? · Can the device be calibrated? On the calibration screen do the points react to being touched (next point is displayed)? · Does the cursor move when the device is in use? · Does it work for a short while then fail? (e.g. after power management has hibernated the system or following a reboot?). · Does it fail in some very specific situation? · If there is no cursor movement does the device starts working after you the reinitialize or reload option in the UPDD Console, Status dialog? Sequence of events leading to the problemIf the fault is obscure and is only seen after a sequence of events please describe the events that need to be performed in order to reproduce the fault. Information requestPlease supply the following information
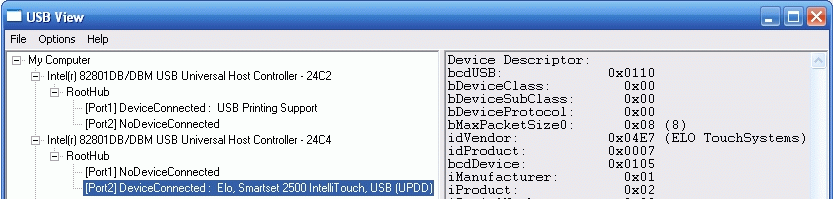
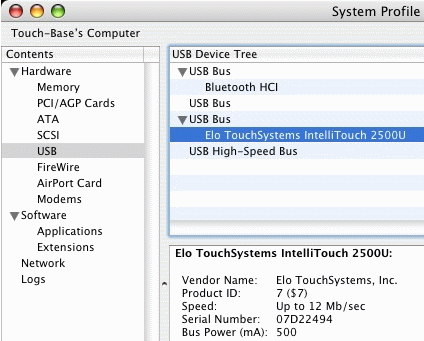
1. In the UPDD Console, About dialog, please list company name and driver version number. 2. In the UPDD Console, About dialog, Support option, please list SCN (Software Support Number). 3. In the UPDD Console, Status please list the information shown. 4. In the UPDD Console, Status dialog, please select the 'Dump settings' option and attach it to this email. 5. In the UPDD Console, please list the name of the controller causing problems 6. If using USB, identify the vendor and product id of the device. 7. If using a serial device and the serial port connection appears not be working there are a number of procedures to follow to help identify the problem as described in the knowledge base article here. 8. If using a 9.
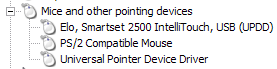
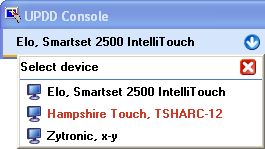
Please list the devices shown in UPDD Console device list, are they
shown in red or black (red indicating unplugged/not available)? 10.
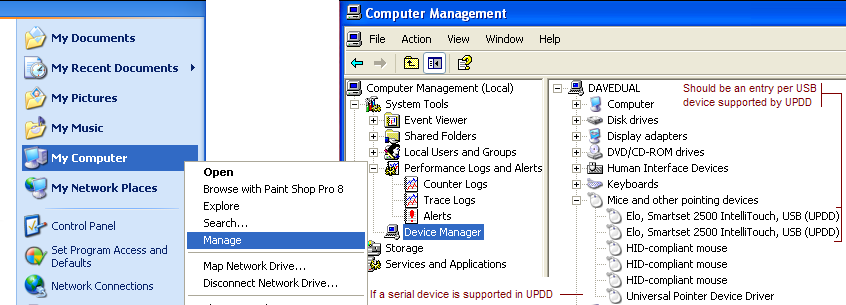
For Windows, send a screen print of the Device Manager ‘Mouse/Mice and
other pointing devices’ branch. The easiest way to the Device Manager is to
right click the My Computer icon or start menu entry, select Manage and
select Device Manager: 11. Please indicate the OS in use and its locale (e.g. English, French, Japanese etc) 12. If requested, please supply a debug trace as described below in the debug section. 13.
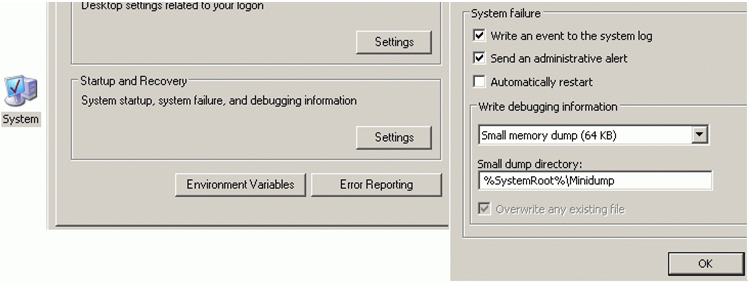
Under Windows, if the error is causing a Blue Screen Crash – commonly
known as a BSOD - we will need a system memory dump at the time the crash
occurs. The dump is requested as follows: in the control panel -> system
-> advanced -> startup and recovery. Select small memory dump. After a
BSOD the dump file will be located in SystemRoot%\Minidump (or whatever was
set in the control panel). Send the file related to the crash using the
timestamp of the file to determine the correct file. 14.
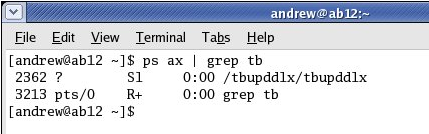
UPDD program symbols: 15. Under Linux please supply the following information: 1.
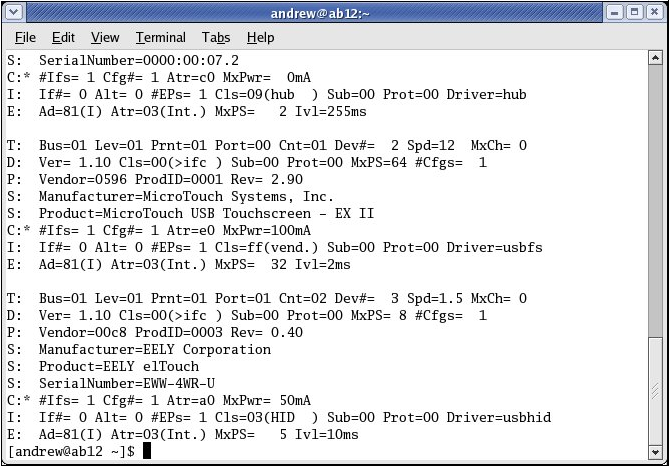
The outcome of typing "ps ax | grep tb" into a terminal. 2.
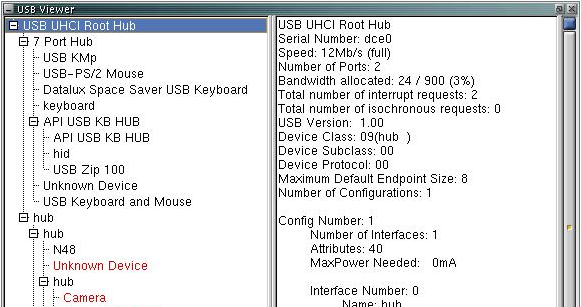
For USB controllers, the outcome of typing "cat
/proc/bus/usb/devices". Support ProcedureBased on the above information we will advise if we know of a fix or we will investigate further. We may require a debug log (see below) to be captured on the failing system. If we do not know what the problem is and cannot reproduce we may ask for the system to be sent to us if this is possible. Debug ProceduresDifficult to reproduce or to identify UPDD problems sometimes require a debug trace to be captured. The debug trace is enabled within the UPDD driver and the debug output is sent to the ‘standard out’ port on the OS. With UPDD versions up to 4.1.10, build 2113 debug messages were either On (DebugLevel setting = 5) or Off (DebugLevel setting = 0). However, starting with UPDD version 4.1.10, build 2114 the user mode component has 4 settings, 0,1,2 and 3 (and 5 to be backward compatible). 0 – no debug messags 1 – non-time critical messages 2 – non-time critical messages 3/5 - all messages including debugging in the interrupt path
Non-time critical messages will be allocated to either level 1 or 2 such as often repeated message, e.g. in polling functions.
Critical messages that can affect performance and critical path functionality, such as hardware interface interrupt procedures.
Note: The Windows Kernel mode component is still either on (5) or off (0). Debug preparation
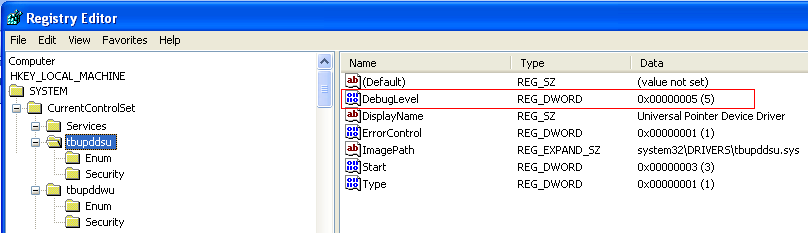
Windows Under Windows we use a kernel debugger (normally DebugView) to capture the debug messages - software that is freely available on the web. Last time we looked it was available here. If not, Google DebugView. There are two parts to the Windows driver, a kernel mode element – TBUPDDSU and a user mode element – TBUPDDWU. Both elements will output debug information if the Debug Level is set to 5. The kernel mode driver references the registry for it’s debug setting and the user mode references the UPDD settings file for its debug setting, as follows; Kernel mode debug setting - TBUPDDSU
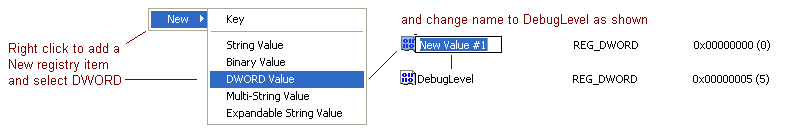
If the DebugLevel entry is missing, Right Click in the window pane, select New, DWORD value and rename the new key to DebugLevel:
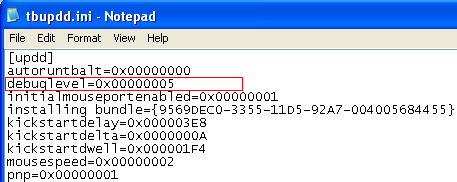
User mode debug setting – TBUPDDWU
To enable debugging: If requested to capture kernel mode debug messages use Regedit to set HKLM/System/CurrentControlSet/Services/tbupddsu/debuglevel setting to 5 and reboot the system (as shown above). If requested to capture user mode debug messages use the following procedure whilst logged on as a user with administrator rights 1) If using UPDD
5.1.0 it is only necessary to run the command “tbutils global setting dw
debuglevel 5”. The driver will be reloaded and in debug mode. 2) Stop the driver as follows: ·
With UPDD 4.1.6, build 1200 and above (Start, Run) Net Stop
TBUPDDWU · With earlier builds to stop the user mode driver you need to kill the TBUPDDWU process either via the Task Manager, end process:
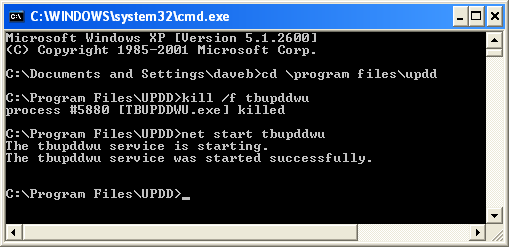
or, if the above does not work, change directory to c:\program files\updd and “kill /f tbupddwu”
2) Use Notepad to set TBUPDD.INI file debuglevel setting to 1,2,3 or 5 as requested. 3) Reboot the system or start the user mode driver with the command “Net Start TBUPDDWU” as shown above. Mac OS X If requested to capture user mode debug messages use the following procedure: For Mac OS X you can run the driver from a terminal (console) and view the debug log messages or redirect them to a file. If using UPDD 5.1.0 it is only necessary to run the command “tbutils global setting dw debuglevel 5”. The driver will be reloaded and in debug mode If not running 5.1.0 then: To stop the driver run up a terminal window (sometimes known as a Console) and type ‘sudo killall tbupddwu’. To enable debugging: Open up a terminal window cd /tbupddmx cp tbupdd.ini ~/tbupdd.ini open -a textedit ~/tbupdd.ini Use the text editor to make the change, save and close sudo cp ~/tbupdd.ini tbupdd.ini
Linux If requested to capture user mode debug messages use the following procedure: For Linux you can run the driver from a terminal (console) and view the debug log messages or redirect them to a file. If using UPDD 5.1.0 it is only necessary to run the command “tbutils global setting dw debuglevel 5”. The driver will be reloaded and in debug mode If not running 5.1.0 then: To stop the driver run up a terminal window (sometimes known as a Console) and type ‘sudo killall startupdd’ ‘sudo killall tbupddwu’ To enable debugging: Open up a terminal window cd /opt/tbupddlx cp tbupdd.ini ~/tbupdd.ini open -a textedit ~/tbupdd.ini or gedit ~/tbupdd.ini Use the text editor to make the change, save and close sudo cp ~/tbupdd.ini tbupdd.ini
export LD_LIBRARY_PATH=/opt/tbupddlx:$LD_LIBRARY_PATH sudo ./tbupddwu to see the debug log in the terminal window or ‘sudo ./tbupddwu >updddebuglog’ to redirect the console output to a log file. Debug message captureOnce debug is enabled, run up the kernel debugger under Windows or start the driver in a terminal Window under Linux/Mac OS X and recreate the problem and send the debug log to Touch-Base for analysis.
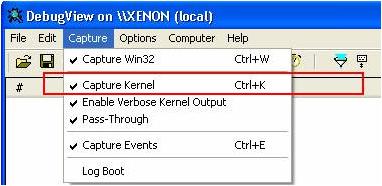
If capturing a kernel log and using DebugView please ensure the kernel capture setting is enabled:
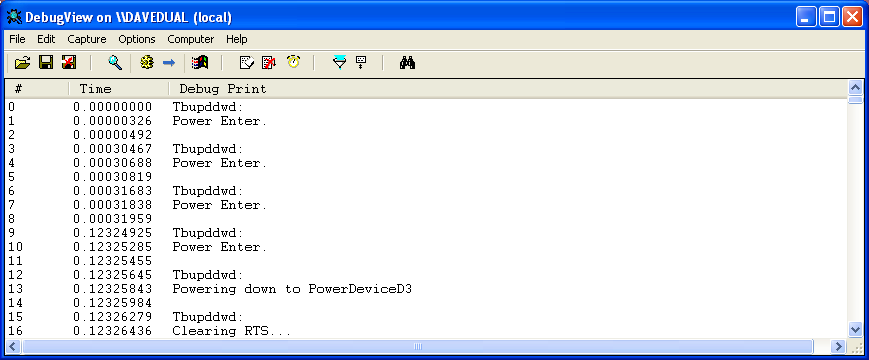
If the driver is failing to load or the load sequence is required then run up the UPDD Console and select reload from the status screen. When the Reload option is selected in UPDD it effectively reinitialises the driver and hardware port, outputting debug messages at each stage. These messages are displayed in the debug dialog and should be saved and sent to Touch-Base for analysis.
Example:
Windows
User reports that touch screen is taking excessive time to
become active after system has been sleeping: 1) Set both debug levels to 5 (kernel and user) and reboot system. Check touch is active. 2) Invoke the kernel debugger (e.g. locate and run DebugView application) 3) Place system
in sleep (or standby / hibernate) and return from sleep 4) Use DebugView,
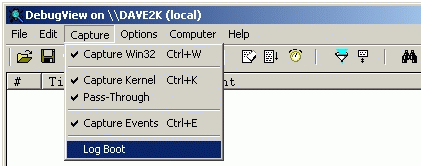
File, Save As to save debug log. Capturing debug over a reboot (Windows)In some circumstances we may need to see the debug log over a system boot rather than when the driver is reloaded. In this instance the kernel debugger may have an option to log kernel debug output over a reboot as shown below in the DebugView debugger:
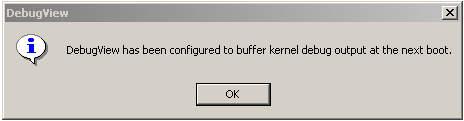
Selecting this option in DebugView acknowledges that data will be captured at next reboot:
The debugger will capture all the debug messages produced by the driver during the reboot load.
Controller data captureOccasionally we would like to view the raw data received from the controller. This can be achieved in one of two ways: Tbcalib test modeTbcalib program has a test mode to log single point touch data to a file. Tbcalib diag modeTbcalib program has a diagnostic mode to log trace data pattern to a file.
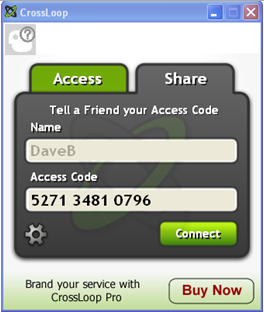
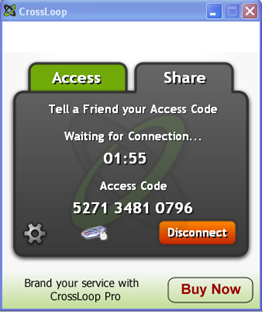
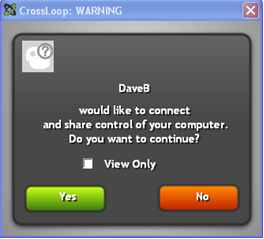
Remote AccessIn some cases it is desirable to be able to remotely connect to a failing touch system to help identify the problem. We prefer to utilize a remote access product called Crossloop, available for free from http://www.crossloop.com/ipage.htm?id=predownload (the free, non professional version should be available). To make the system available for remote control, ensure it is physically connected to the internet, install and run the crossloop application (you do not need to register for an account) which will issue a unique session identifier which you need to pass on to the Touch-Base technician (phone or via on-line chat using Skype or Google Talk). Using this code the technician can connect to and take control of the system, as shown below:
UploadsAny files requested to be sent to Touch-Base can be sent as email attachments or placed directly on our upload server at http://upload.touch-base.com – useful for very large attachments. Click on the link or enter this URL in any browser and you will see a drop zone in the browser to which you can drag and drop the file(s). ContactFor further information or technical assistance please email the technical support team at technical@touch-base.com
|
||||||||||||||||||||||||||||||||||||||||||||||